By: Ned_W_Schmidt

 Over the past five years, barley, of the eighteen commodities we follow, was the top performer. Rising by 180+% it bested Gold, +170%, and Silver, +150%. But why quibble? Nearly all commodity prices have done than paper equities. And perhaps they should, as real assets require real work to produce and are essential to the real world.
Paper equities, today really electronic equities, are created for every willy nilly idea around in abundance and without constraint. Does anyone truly believe that Facebook will still exist as a meaningful venture in a decade? Pachinko machines were once a social networking fad, but too faded. The world needs barley and other Agri-Foods to live, and FarmVille will just not do.

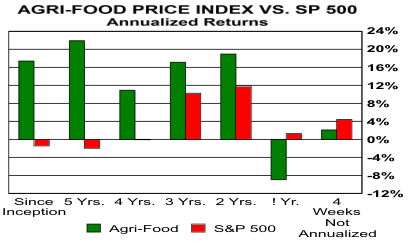
Above chart portrays the returns over the past 5+ years for Agri-Commodities and the S&P 500. The dominance of those green bars is readily apparent, even to a hedge fund analyst. By the way, we chose red for the equity market bars as it has spent most of the past decade plus generating losses rather than profits.
Over the past 5+ years only one of the Agri-Commodities we follow failed to do better than the S&P 500. That one was eggs. However, to give eggs their due, they serve many useful purposes. Breakfast being one that comes immediately to mind. On the other hand, paper equities apparently provide little of value.
In the above chart one green bar for Agri-Commodities is negative. That is the one for the most recent year. Agri-Commodities have been going through a correction for much of that time. We had been projecting that the correction would be complete by next week. The vagaries of global weather seems to have accelerated the end of the correction. Four weeks ago the Agri-Food Price Index confirmed the low of 10 weeks ago. The Agri-Food Price Index is this week at a 10- week high.

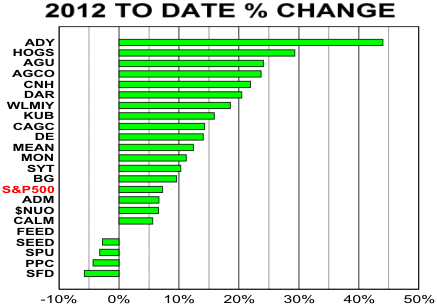
As is readily apparent in the chart above, some investors have recognized the situation in Agri-Foods. In that chart is plotted the 2012 year-to-date price performance of a sampling of Agri-Equities. ADY, a Chinese milk operation, apparently has disappointed the internet rumor mongers. It has advanced strongly thus far this year on some heavy volume. Seems the Chinese will likely continue drinking milk, lots of it.
HOGS has developed some following as the year opened. These are the ones that are eaten, not driven. HOGS produces branded pork products for retail food outlets in China. Company apparently does know hogs as they once noted on their web site that they had 200+ ways to cut one up.
The next decade may be the best ever seen in Agri-Food. We do anticipate at a minimum one major correction in Agri-Foods in the next 12-24 months. which will be largely focused in popular grains. That development, should it occur, should put in place beginning of Wave V for Agri-Commodities. As many know from their ride in Gold and Silver, Wave V is as good to investors as it gets.
By Ned W Schmidt CFA, CEBS
AGRI-FOOD THOUGHTS is from Ned W. Schmidt,CFA,CEBS, publisher of The Agri-Food Value View, a monthly exploration of the Agri-Food grand cycle being created by China, India, and Eco-energy. To contract Ned or to learn more, use this link: www.agrifoodvalueview.com.
Copyright ? 2012 Ned W. Schmidt - All Rights Reserved
? 2005-2012 http://www.MarketOracle.co.uk - The Market Oracle is a FREE Daily Financial Markets Analysis & Forecasting online publication.
Comments
Post Comment (Moderated)
Source: http://www.marketoracle.co.uk/Article33087.html
bank transfer day daylight savings 2011 day light savings day light savings us geological survey us geological survey oklahoma
No comments:
Post a Comment
Note: Only a member of this blog may post a comment.